- 0、学前准备
- 0.0 APP.module.ts配置
- 1.0 TypeScript语言简介
- 2.0 如何在TypeScript中引入js包
- 3.0 pipes的使用
- 4.0 双向数据绑定
- 5.0 页面跳转
- 6.0 声明属性 绑定数据
- 7.0 请求数据
- 8.0 父子组件传值
- 9.0 ionic3 开发之工作原理(
- 1、环境配置
- 1.1 开发环境搭建
- 1.2 VS Code软件语言
- 1.3 Git账号初始化
- 2、开始第一个App
- 2.0 使用Git进行版本控制
- 2.1 创建并运行App
- 2.2 修改应用图标启动界面包名
- 2.3 Ionic3新特性懒加载
- 2.4 使用懒加载改造现有页面
- 2.5 创建一个新的页面
- 2.6 Ionic3封装全局网络请求服务
- 2.7 上拉更新与下拉更新
- 2.8 常用开发技巧
- 2.9 UI设计
- 3.0 搜索页面设计与开发
- 3.1 安卓下硬件返回键的处理
- 3.2 tabs默认选中项
- 3.3 ionic3&echarts
- 3、插件使用
- 3.1 禁止App横屏
- 3.2 调用照相机拍照
- 3.3 拍照文件上传
- 3.4 图表报表chart.js
- 3.5 百度地图SDK秘钥申请
- 3.6 极光推送
- 3.7 扫描二维码
- 3.8 百度定位Android版插件
- 3.9 自己写的手机端即时聊天
- 3.10 极光推送
- 3.11 卸载插件
- 3.12 热更新
- 3.13 音频、视频播放
- 3.14 App在线升级
- 3.15 检查硬件权限
- 3.16 图片预览大图
- 4、App打包
- 4.1 使用Android studio打包
- 4.2 使用命令打包
- 4.3 Ionic3启动慢解决方法
- 4.4 解决同台手机兼容问题
- 4.5 创建打包用的key
- 5、常见错误
- 5.1 创建项目时常见错误
- 5.2 添加Android环境时常见错误
- 5.3 Without `from` option
- 5.4 ionic版本降级操作
- 5.5 多人同时打包失败的一次记录
- 5.6 百度地图定位出错问题
- 5.7 ionic3 iOS真机http请求失败
- 5.8 百度地图定位第一次失败
- 5.9 ionic3 打包报错[ERROR]
- 5.10 一直在欢迎页面进不去
- 5.11 升级bug
- 5.12 ionic3程序安装冲突
- 请求不能跨域
- 6、项目实战
- 6.0 界面样式
- 6.1 百度地图
图标报表
发布时间 2018-5-23 16:06:34
浏览量()
收藏(1)
ionic3提供的组件已经相当丰富咯,但是事实上有些特殊的需求,比如使用百度地图,或者第三方插件echart报表插件是,就不能用传统的方式去使用第三方插件咯,如何在Ionic3项目中使用第三方JavaScript库?.其实特别简单啦,跟着我步伐前进吧。
1、切换到项目目录全局安装typings
npm install -g typings
2、使用Typings搜索Chart.js
typings search chart.js
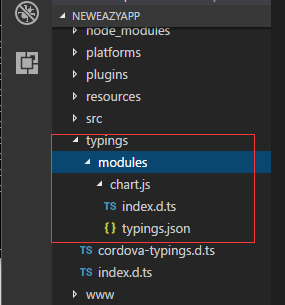
如下图找到了3个 我们使用来源是npm的那个

3、在app目录执行
typings install chart.js --source npm

4、安装chart.js依赖
npm install chart.js
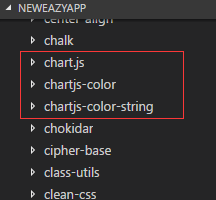
在node_modules目录下生成的文件

5、界面代码
<ion-header>
<ion-navbar>
<ion-title>
图表示例
</ion-title>
</ion-navbar>
</ion-header>

<ion-content>
<div padding-vertical>
<canvas #chartBar height="200"></canvas>
</div>
<div padding-vertical>
<canvas #chartLine height="200"></canvas>
</div>
<div padding-vertical>
<canvas #chartPie height="200"></canvas>
</div>
</ion-content>
6、ts代码
import { Component, ViewChild, ElementRef } from '@angular/core';
import { NavController,IonicPage } from 'ionic-angular';
import Chart from 'chart.js'; // 导入chart.js

@IonicPage()
@Component({
selector: 'page-contact',
templateUrl: 'contact.html'
})
export class ContactPage {
@ViewChild('chartBar') chartBar: ElementRef;
@ViewChild('chartLine') chartLine: ElementRef;
@ViewChild('chartPie') chartPie: ElementRef;
constructor(public navCtrl: NavController) {

}
ionViewDidEnter() {
Chart.Bar(this.chartBar.nativeElement.getContext("2d"), {
data: {
labels: ["Red", "Blue", "Yellow", "Green", "Purple", "Orange"],
datasets: [{
label: '呵呵',
data: [12, 19, 3, 5, 2, 3],
backgroundColor: [
'rgba(255, 99, 132, 0.2)',
'rgba(54, 162, 235, 0.2)',
'rgba(255, 206, 86, 0.2)',
'rgba(75, 192, 192, 0.2)',
'rgba(153, 102, 255, 0.2)',
'rgba(255, 159, 64, 0.2)'
],
borderColor: [
'rgba(255,99,132,1)',
'rgba(54, 162, 235, 1)',
'rgba(255, 206, 86, 1)',
'rgba(75, 192, 192, 1)',
'rgba(153, 102, 255, 1)',
'rgba(255, 159, 64, 1)'
],
borderWidth: 1
}]
},
options: {
scales: {
yAxes: [{
ticks: {
beginAtZero: true
}
}]
}
}
});

Chart.Line(this.chartLine.nativeElement.getContext("2d"), {
data: {
labels: ["January", "February", "March", "April", "May", "June", "July"],
datasets: [
{
label: "哈哈",
fill: false,
lineTension: 0.1,
backgroundColor: "rgba(75,192,192,0.4)",
borderColor: "rgba(75,192,192,1)",
borderCapStyle: 'butt',
borderDash: [],
borderDashOffset: 0.0,
borderJoinStyle: 'miter',
pointBorderColor: "rgba(75,192,192,1)",
pointBackgroundColor: "#fff",
pointBorderWidth: 1,
pointHoverRadius: 5,
pointHoverBackgroundColor: "rgba(75,192,192,1)",
pointHoverBorderColor: "rgba(220,220,220,1)",
pointHoverBorderWidth: 2,
pointRadius: 1,
pointHitRadius: 10,
data: [65, 59, 80, 81, 56, 55, 40],
spanGaps: false,
}
]
}
});

Chart.Doughnut(this.chartPie.nativeElement.getContext("2d"), {
data: {
labels: [
"Red",
"Blue",
"Yellow"
],
datasets: [
{
data: [300, 50, 100],
backgroundColor: [
"#FF6384",
"#36A2EB",
"#FFCE56"
],
hoverBackgroundColor: [
"#FF6384",
"#36A2EB",
"#FFCE56"
]
}]
}
});

}
}
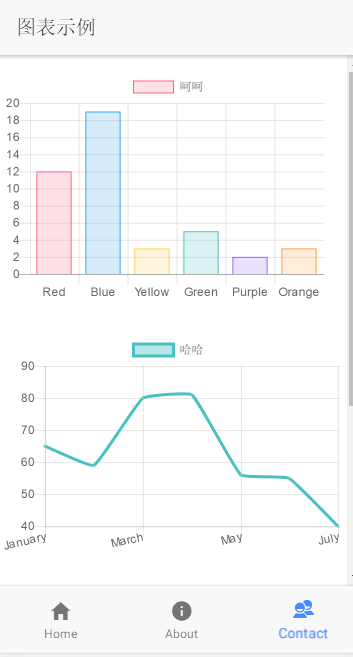
7、最后上截图

广告会让浏览体验不好,可这是网站的唯一收入,请点击下面的百度广告,支持老高的开源行动吧!